Problem Framing & Big Picture
Problem: Many students may struggle in school due to a variety of factors, which can lead to poor grades and reduced educational and career opportunities.
Solution: I propose a machine learning-based solution that analyzes a range of factors, including academic performance, attendance records, and socio-economic indicators, to predict a student's future academic performance. By identifying students who are predicted to have lower grades, we can proactively enroll them in tutoring programs tailored to their specific needs.
Approach
Supervised / Offline Learning
Supervised Learning: The model learns from historical data on students, including features (like study habits, attendance, etc.) and their final grades, to predict future performance.
Offline Learning: The model is trained on a collected set of data all at once, rather than continuously learning from new data.
Regression Task
This project involves a regression task to predict a student's specific final grade (a continuous value) based on various factors. Understanding the precise grade prediction allows for tailored interventions, as opposed to a simple pass/fail classification.
Metrics to Measure Performance
- Mean Absolute Error (MAE): Provides a prediction of accuracy, with a lower MAE indicating better performance.
- Mean Squared Error (MSE): Measures the average squared difference between predicted and actual values. A lower MSE indicates better accuracy.
- Root Mean Squared Error (RMSE): The square root of MSE, offering an interpretable metric of prediction accuracy.
Non-Technical Explanation
Imagine you have to get up early tomorrow morning. If you look at all of your habits today—like staying up late, eating junk food, and not drinking enough water—you may be able to predict whether you'll feel tired. We're applying a similar idea using machine learning to understand patterns in student performance, so we can foresee who might need external help before they begin to fail.
Guardian Type Distribution
This bar chart visualizes the distribution of guardian types among students, categorized into mother, father, and other.
The analysis highlights which guardians play a primary role in students' lives, providing insights into family dynamics and their potential influence on academic performance.
Key Highlights:
- Mothers: The majority of students have mothers as their primary guardians, representing the largest group in the dataset.
- Fathers: Fathers make up a smaller, yet significant, portion of the guardian group.
- Others: A minimal percentage of students report guardians other than mothers or fathers, suggesting unique family circumstances.
- Visual Dominance: The bar for mothers is significantly taller, indicating a strong majority compared to other guardian types.
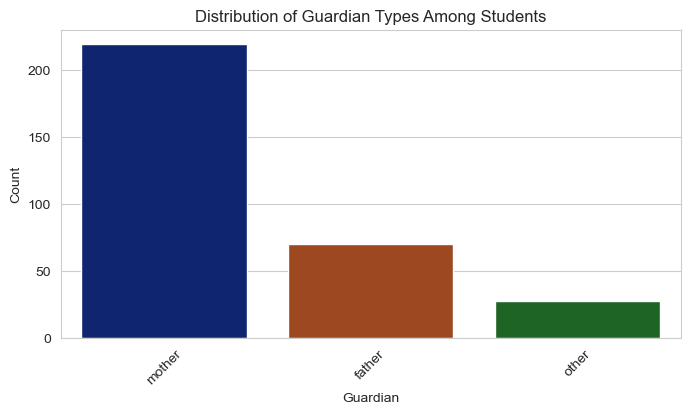
Key Insight: Mothers serve as the primary guardians for most students, with fathers and others playing comparatively smaller roles. This understanding helps us explore further how family dynamics, such as guardian involvement, influence student performance, study time, and overall academic engagement.
Study Time vs. Health Status
This boxplot visualizes the relationship between students' self-reported health status
(on a scale of 1 to 5) and their average study time. It reveals key trends
regarding how health impacts study habits.
Key Highlights:
- Health Rating 3 and 4: Students with moderate health ratings dedicate the most study time, indicating a potential balance between health and academic commitment.
-
Lower Health Ratings: Students with a health rating of
1tend to study less, which may be linked to their lower well-being impacting academic focus or energy levels. -
Higher Health Ratings: Surprisingly, students with the highest health rating (
5) also show less study time, suggesting they may spend more time on non-academic activities or social well-being. -
Variability: Health ratings of
3and4exhibit greater variability in study time, as seen by the larger interquartile ranges, while1and2show more compact distributions. - Outliers: Students across all health categories exhibit outliers, indicating individual variations in study habits.
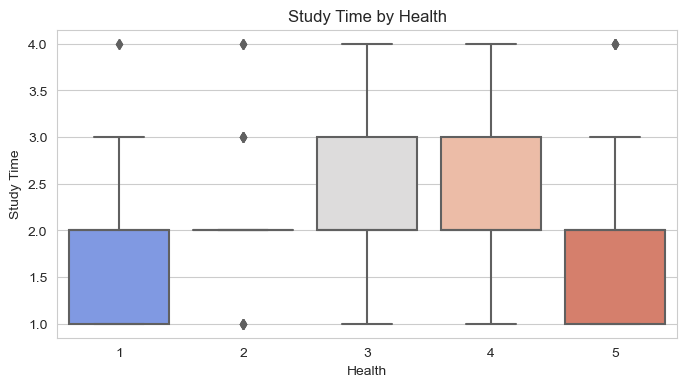
Key Insight: Students with moderate health ratings (3 and 4) appear to prioritize study time the most, suggesting a balanced focus on academics. On the other hand, students with very low or very high health ratings dedicate less time to studying, potentially due to health-related constraints or alternative priorities.
Scatter Matrix of Selected Attributes
This scatter matrix visually showcases pairwise relationships between key attributes,
including students' performance across G1, G2, and G3 grades,
as well as absence patterns (absences_G1, absences_G2, absences_G3).
The diagonal histograms reveal distributions of each variable, while the scatter plots highlight trends
and correlations.
Key Highlights:
- Grade Progression (G1, G2, G3): Strong positive linear relationships between grades indicate consistent performance progression over time.
- Absence Trends: Absences in each grade period show weaker relationships with final grades, though visible patterns exist.
- Distribution Insights: Histograms on the diagonal demonstrate concentrated ranges for grades and absences.
- Identifying Patterns: Pairwise scatter plots highlight trends or potential outliers between grades and absences.
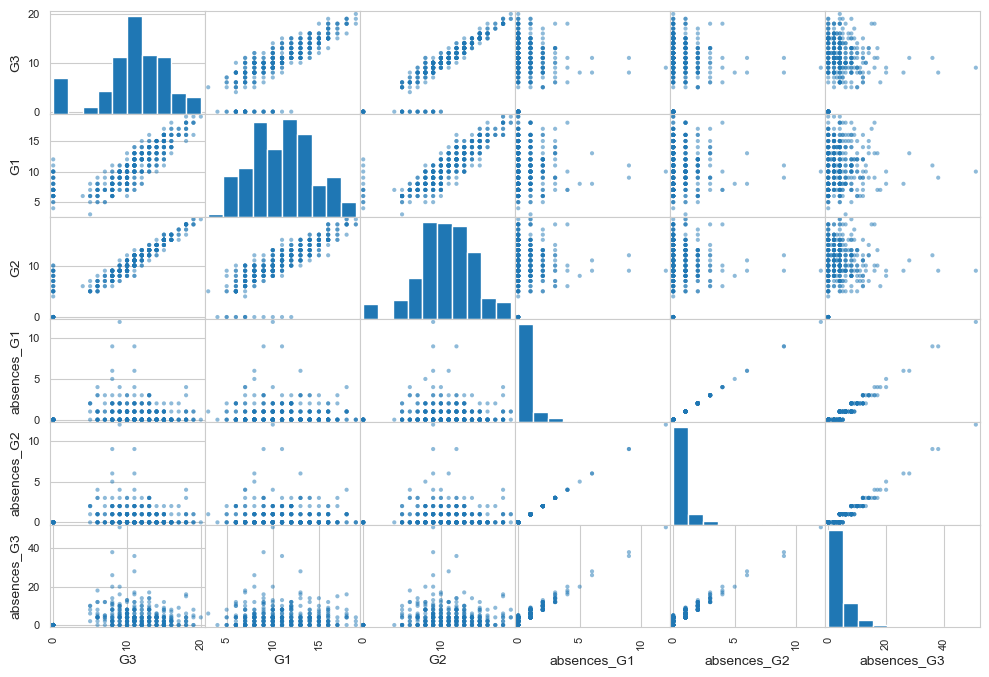
This visualization is instrumental for identifying linear relationships, spotting trends, and detecting outliers between grades and absence patterns, helping inform strategies to improve student performance.
Conclusion
My initial goal was to leverage machine learning to proactively identify students at risk of underperforming, enabling timely interventions through targeted tutoring programs. By employing Mean Absolute Error (MAE), Mean Squared Error (MSE), and Root Mean Squared Error (RMSE) as success metrics, I assessed the performance of the regression model.
With an MAE of 1.139, the predictions are, on average, approximately one grade point away from the actual grades. While this precision offers a practical means to pinpoint students at risk, an MSE of 4.860 and an RMSE of 2.204 suggest room for improvement.
Next steps include:
- Iterating on the current model to reduce both MAE and RMSE.
- Conducting a more in-depth feature importance analysis to identify key factors impacting student performance.
- Exploring more advanced models or incorporating additional features for better predictions.
Access the Full Project
This project is restricted. Please contact me to request access to the full Jupyter Notebook.